> ## Documentation Index
> Fetch the complete documentation index at: https://docs.arnio.co/llms.txt
> Use this file to discover all available pages before exploring further.
# Analytics
> Learn how to track performance metrics like open rates, replies, and engagement
# Analytics Dashboard
> The Analytics dashboard helps you monitor message engagement, lead responsiveness, and AI performance over time — giving you insight into what’s working and what needs improvement.
>
> \> Navigate to **Analytics** in the left sidebar of your Arnio dashboard.
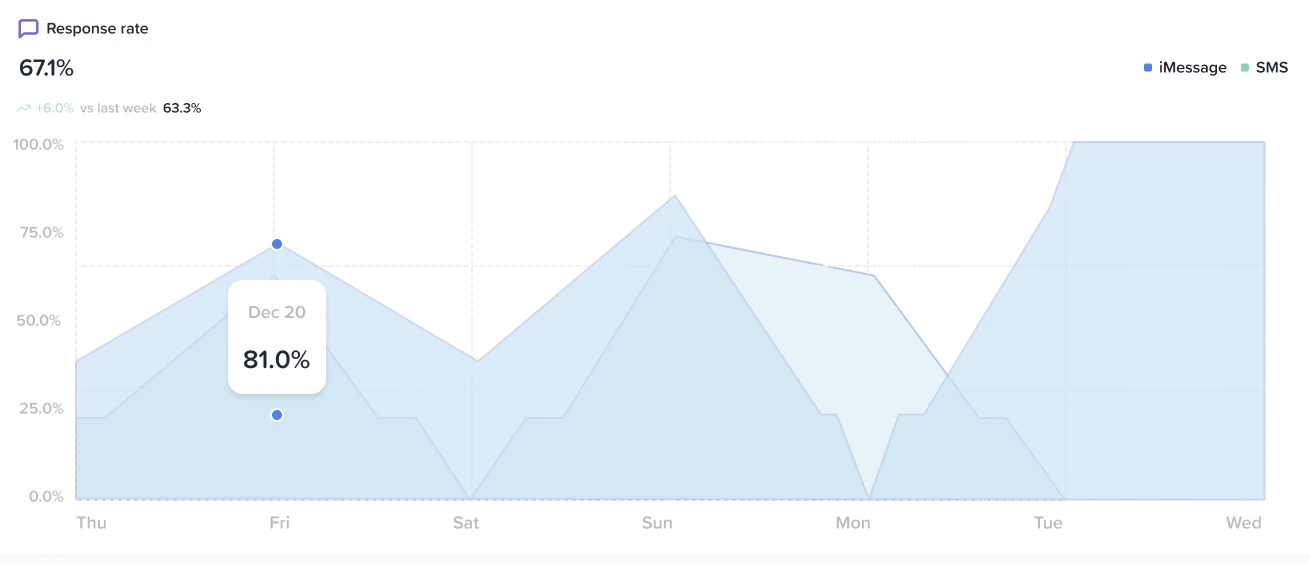
## Response Rate
**Definition:** The percentage of messages that received a response (from the lead or from your AI/human team).
* Split by **iMessage** and **SMS**
* Use the graph to view response trends across days
* Hover to view exact percentages for each day
* Split by **iMessage** and **SMS**
* Use the graph to view response trends across days
* Hover to view exact percentages for each day
## Total Conversations
Shows how many new conversations were initiated during the selected time range.
* Compare performance with previous periods
* Helps identify campaign engagement or drop-off
## Average Time to Response
This metric tracks how long it takes your AI or team to respond to incoming messages.
* Lower is better (especially for first-touch replies)
* Helps you optimize response windows and AI timing
## Pickup Rate *(Coming Soon)*
The percentage of conversations that continued after the first reply.
* Indicates how effective your opener and follow-up strategy is)
* Influenced by message timing, personalization, and offer quality
## Speed to Dial *(Coming Soon)*
Tracks the time between lead inquiry and your team dialing them (if applicable).
* Helps sales teams optimize handoff and follow-up actions
* Lower times correlate with higher close rates
## Number of Calls *(Coming Soon)*
Tracks how many calls were made from within the platform (if calling is enabled).
* Use this to gauge outbound activity
* Combine with Speed to Dial for context
## Unresponded Messages
Messages that received **no reply** from your AI or team.
* Review and triage these inside the **Conversations** tab
* High counts here may signal underperformance or misconfigured AI rules
## Filtered by Date
Use the date picker in the top-right corner of the dashboard to filter metrics by:
* **Daily**
* **Weekly**
* **Monthly**
 ##
##  ##
##  ##
##  ##
##  ##
##  ##
##  ##
## 